Introduction
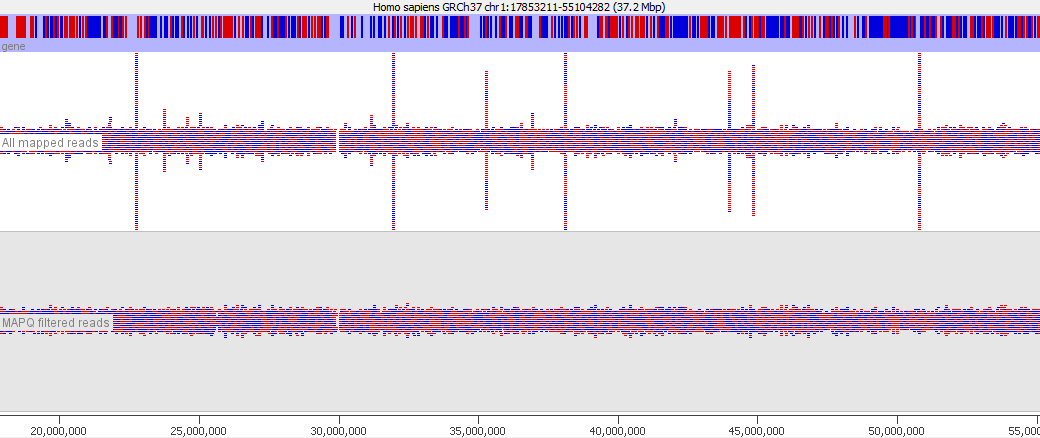
In various stages of the processing of an NGS dataset it can be useful to filter the data to remove poor quality reads. At an early stage this could be reads with poor quality base calls, but after mapping to a reference genome you may want to filter out alignments which show a poor match to the reference, or which could have mapped to a number of different places in the genome. These ambiguously mapped reads can add a lot of noise to an analysis and will tend to accumulate over repetitive regions. In the example below you can see the comparison of the reads from a standard bowtie2 mapping of a genomic dataset, and the result of applying a MAPQ filter to the data. The peaks over repetitive elements are largely suppressed in the filtered data.
To aid with this task the SAM format specification defines the mapping quality (MAPQ) value. In the spec the value is described as:
MAPping Quality. It equals -10 log10 Pr {mapping position is wrong}, rounded to the nearest integer. A value 255 indicates that the mapping quality is not available.
So in the spec this is pretty clear, it’s analogous to a Phred score in a fastq file in that it’s a simple transformation of the probability that the mapped position reported is wrong.
In practice, unfortunately, the use of this value is much less clear. For many types of read mapper there is no sensible way to put a p-value on the likelihood that a reported mapped position is wrong so rather than stick to the published spec the aligners have taken the valid value range (0-255) and implemented their own scoring scheme on top of this.
In many cases the values encoded in the MAPQ value hold useful information about the reads and are a valuable resource when filtering data, but the variability with which the value is calculated means that it can be difficult to create pipelines which use this value and which are robust to changes in the aligner used.
Implementation
To try to make more sense of this we’ve gone through the documentation of a bunch of the most popular aligners to see how they make use of the MAPQ value.
Bowtie1
Bowtie1 sets the MAPQ value to 255 for uniquely mapped reads and 0 for multiply mapped reads, unless the --mapq flag was added when the program was launched, in which case the value specified will be used instead.
Bowtie2
Reference – this page has a great explanation for how alignments in bowtie2 are scored and MAPQ values are assigned.
Bowtie 2 uses a system of flag values for its mapped alignments based on the number of mismatches of various qualities, and the number of multi-mapping reads.
MAPQ >= X   #MM Q40   #MM Q20      #MM Q0    Description
0           5         7            15        All mappable reads
1           3         5            10        True multi w/ "good" AS, maxi of MAPQ >= 1
2           3         5            10        No true multi, maxi of MAPQ >= 2
3           3         5            10        No true multi,  maxi of MAPQ >= 3
8           2         4            8         No true multi, maxi of MAPQ >= 8
23          2         3            7         No true multi, maxi of MAPQ >= 23
30          1         2            4         No true multi, maxi of MAPQ >= 30
39          1         2            4         No true multi, maxi of MAPQ == 39*
40          1         2            4         No true multi, only true uni-reads
42          0         1            2         Only "perfect" true unireads
In the case of bowtie2 therefore you could use a MAPQ filter of >=40 to get reads which had only 1 convincing alignment, or a lower filter to allow multi-mapped reads where there was a secondary alignment with varying degrees of difference to the primary.
Bismark
The MAPQ values reported in Bowtie1 mode are always 255 (multiply aligning hits are not reported). In Bowtie 2 mode the MAPQ scores are re-calculated using the Bowtie2 scoring scheme.
BWA
BWA actually follows the SAM spec and reports Phred scores as MAPQ values. The calculation is based on the number of optimal (best) alignments found, as well as the number of sub-optimal alignments combined with the Phred scores of the bases which differ between the optimal and sub-optimal alignments.
Tophat
Tophat uses flag values with specific meanings to populate the MAPQ value field. Older versions of tophat set all values to 255 (not available) but any recent version has used an updated scoring scheme.
- 50 = Uniquely mapping
- 3 = Maps to 2 locations in the target
- 2 = Maps to 3 locations in the target
- 1 = Maps to 4-9 locations in the target
- 0 = Maps to 10 or more locations in the target
There are however some caveats which come with these values!
- Tophat has the option to restrict reporting of hits using the -g parameter and unfortunately the calculation of MAPQ values appears to happen after this filtering resulting in all hits being given a MAPQ of 50. This means that to see meaningful MAPQ values you have to set -g to at least 2 (you can then later filter on the primary alignment flag to remove the secondary alignments).
- Tophat uses a dual mapping strategy where it first tries to align to a transcriptome and only if it doesn’t get a good hit there will it search the entire genome. When you have a read which is uniquely mapped within the transcriptome, but has multiple hits within the genome as a whole the hit will be reported as unique and given a MAPQ of 50, which can result in artefacts in downstream analyses.
STAR
Star uses a similar scoring scheme to tophat except that the value for uniquely mapped reads is 255 instead of 50.
The mapping quality MAPQ (column 5) is 255 for uniquely mapping reads, and int(-10*log10(1-1/[number of loci the read maps to])) for multi-mapping reads. This scheme is same as the one used by Tophat…
HiSat2
The HiSat2 manual helpfully has no information at all on the meaning of the MAPQ values it assigns. The code which generates it though at least gives some better clues. It looks like the MAPQ value is based on two factors – whether the aligner finds more than one hit, and whether the best hit it finds is a perfect match. It then generates a set of MAPQ values based on the degree to which an alignment is perfect, and the difference between the best alignment and the second best one. The scoring matrix can be seen here.
In effect it seems that the score for a perfect unique alignment is 44. A perfect alignment with a secondary hit will scale down from 42 to 2. An imperfect unique alignment scales down from 43 to 0. An imperfect primary alignment with a secondary alignment scales between 30 and 0.
A pragmatic level to filter at would therefore seem to be somewhere around 40 to get only very good, unique alignments.
Novoalign
Novoalign creates proper probabilistic MAPQ scores, based on the primary and secondary alignments. It also tries to take into account the likelihood that a read might have come from a region of the genome which was not present in the assembly. The full description can be found in sections 4.3.2 of the manual. The MAPQ values are capped at 70.
GSNAP
Since GSNAP is a popular aligner (albeit one that we don’t personally use) I tried to find the details of how it calculates MAPQ scores, but failed. The documentation has no information on this, and although I can find the source file which reports the MAPQ values it has no useful comments and a fairly complex schema so I gave up. If anyone wants to provide a summary of how this works I’ll be happy to add it.
Diagnosis
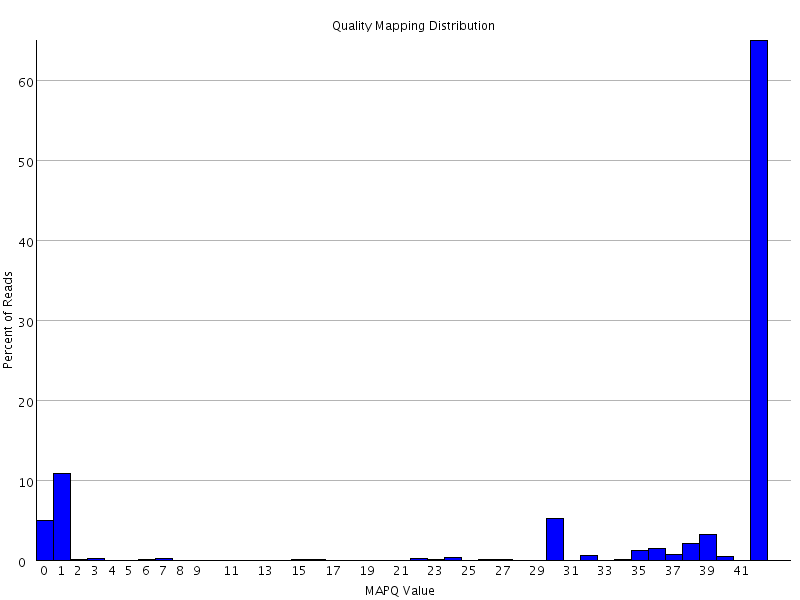
If you’re not sure what MAPQ scoring scheme is being used in your own data then you can plot out the MAPQ distribution in a BAM file using programs like BamQC. This will at least show you the range and frequency with which different values appear and may help identify a suitable threshold to use.
Summary
MAPQ values are a useful and important metric in BAM files. Most aligners will report alignments which are of poor quality either due to high numbers of mismatches, or the presence of high quality secondary alignments and the MAPQ value is an easy filter to remove these. We can see from the data above that the documented meaning of this value is not followed by many of the most common aligners, and is calculated on a different basis in pretty much all of them.
What this means in effect is that before applying MAPQ filtering to your data (which you should) you need to consult the documentation for the aligner you are using to find out what value would be appropriate. Generic pipelines should be aware that there is no common standard for fixing a MAPQ threshold.
7 thoughts on "MAPQ values are really useful but their implementation is a mess"
Miguel Branco
Perfect timing. I have just encountered this issue with MAPQ values in Tophat when -g 1 and hadn’t figured out a solution. Thanks!
Felix Krueger
As a workaround in our Clusterflow pipeline we run Tophat with `-g 2` and filter the data subsequently to remove secondary alignments with `samtools view -F 0x100`.
Roy
When using Hisat2 2-2.0.4, I get mapq values of 0,1 and 60. I just sampled around 1 mil lines. I took it that 60 might be uniquely mapped.
Simon Andrews
The latest beta of hisat changed the scoring scheme so that 60 is now the high score rather than 255 – this is actually better since 255 is a reserved number when you have no sensible value to put in. I’ll update the article when I get a chance to reflect this.
Richard
Thanks for this! I was looking for information on Mapping quality for BWA and STAR and found everything I needed on one page.
Kalium
I am using sRNA datasets and my MAPQ values are 255. Can I considered them as a good alignment from bowtie?
Felix Krueger
I believe Bowtie did not support the concept of assigning MAPQ values, so it uses 255 for each alignment. You thus need to find a different way to judge your aligment quality (e.g. the number of mismatches, and the uniqueness (parameters -m and –strata))
Comments are closed