Introduction
One of the central assumptions of the analysis of sequencing data sets is that each read counts as an independent observation, and that it comes from a separate biological molecule in the original sample. Statistics based on counts will only produce valid p-values if this assumption holds true, so anything which causes this assumption to be violated is a problem in the analysis. Because of the small amounts of material being used, most library preparation protocols still contain at least one PCR step to amplify the library, and this introduces the possibility that multiple sequences in the final library can arise from the same original fragment. Where this type of technical duplication is extensive then the results of analysis can be severely compromised so it’s important that such duplication is identified and, if possible, removed.
The Symptoms
As with many other biases, technical duplication in samples will not cause analysis pipelines to fail. The only effect will be that the results produced at the end of the pipeline are of poor quality, so it can be an easy effect to miss unless you specifically check for it.
If you look at the raw mapped reads for a relatively low density sample, significant amounts of technical duplication are normally easy to spot. Instead of seeing randomly positioned reads what you would observe would be a set of towers of reads where each read would be repeated a number of times, even though the sample as a whole was far from saturating coverage of the region it’s in.
In the example below the samples at the top show technical duplication, with each read being present 2 or 3 times. The samples at the bottom are not duplicated and most reads are in a unique position.
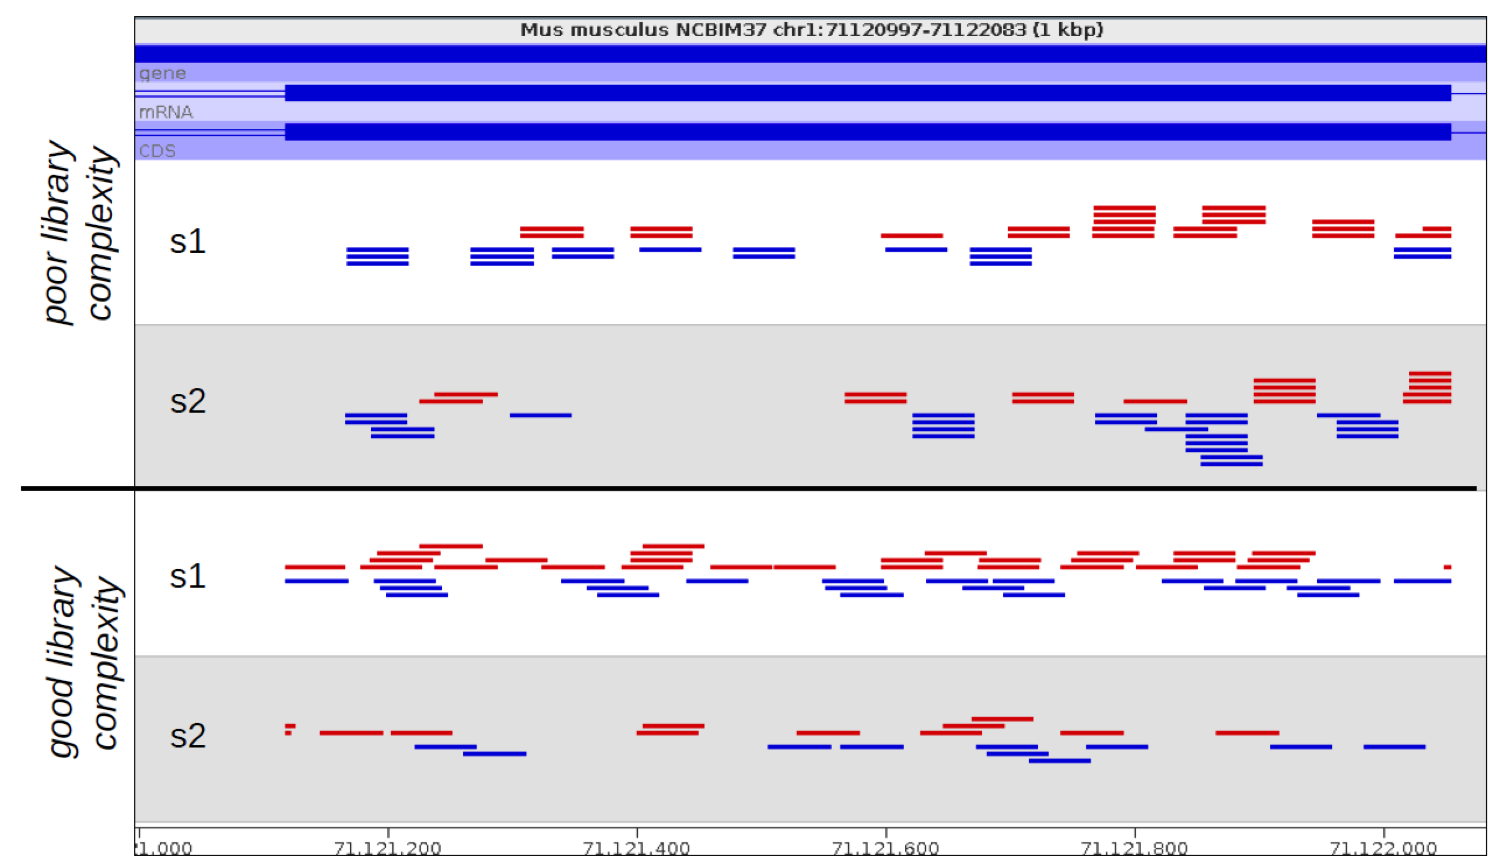
The big problem with identifying and removing technical duplication is that it’s not possible to always assume that two reads falling at the same point are the result of technical duplication. When the overall read density in a region gets too high then you will start to see co-incidental duplication from different biological molecules. For regions with very high read density therefore a simplistic measurement of duplication will confuse high biological read depth with technical duplication.
Diagnosis
Other than a manual examination of the raw data (which is always a good idea) there are some automated ways to look at the duplication levels of samples. At the sequence level programs like FastQC can look at the amount of observed duplication to produce plots like this:
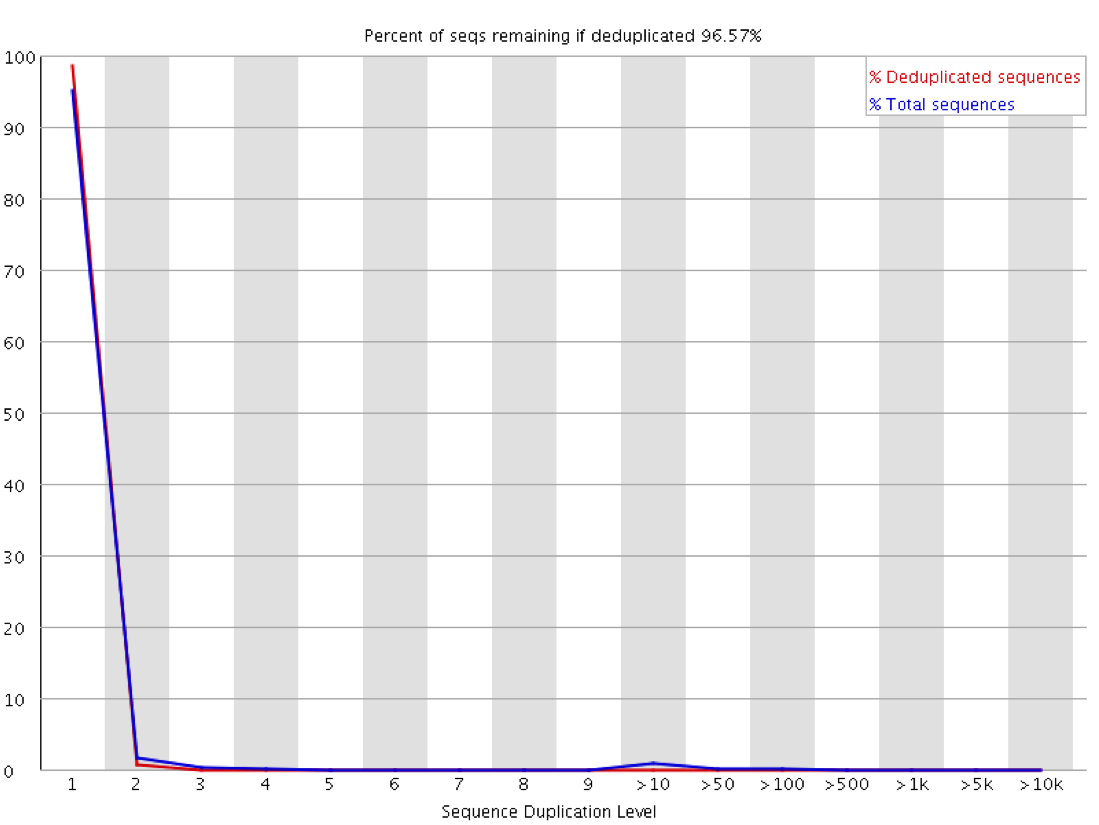
In this plot you can look at the proportion of reads in the library which arise from sequences which occur different numbers of times. In a truly diverse library like this nearly all of the sequences in the library occur only once. The headline figure at the tops tells us that only around 3% of reads would be lost if the library were to be deduplicated.
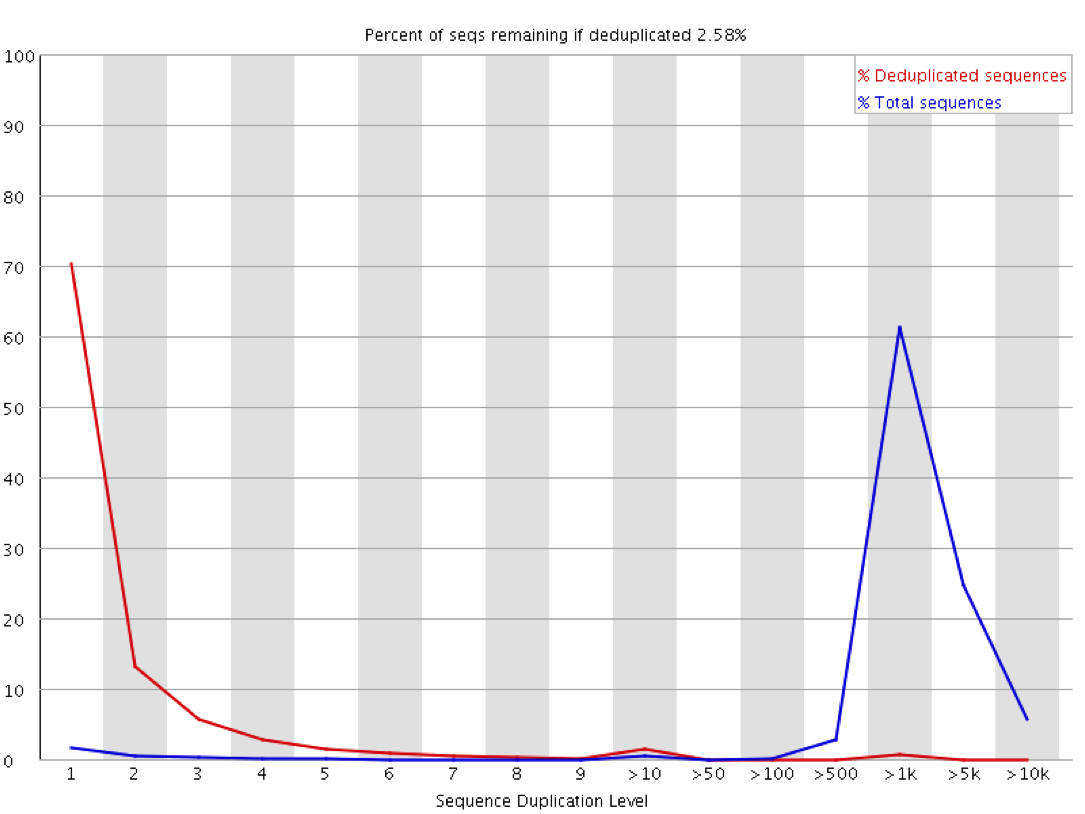
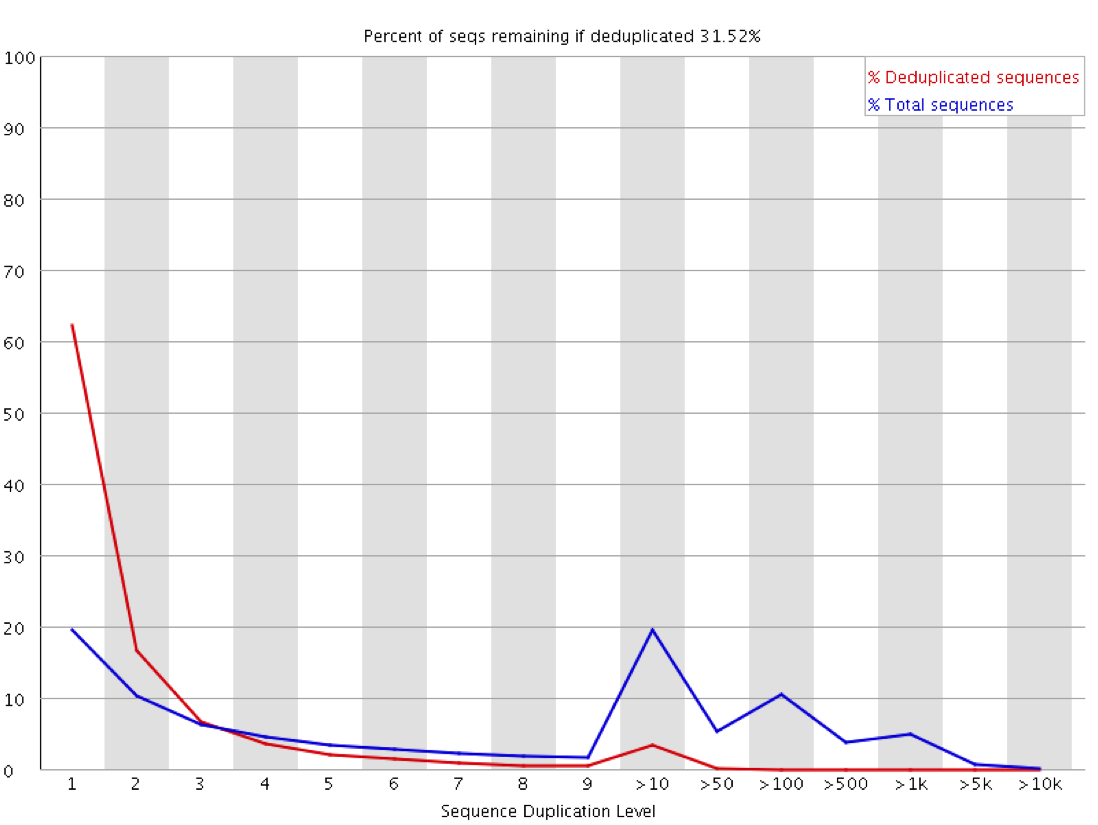
These sorts of plots can be misleading in a couple of ways through. If you have sequenced your library to only a low level then even if the library is moderately duplicated this will not show up since analysis of duplication requires sufficient read depth to observe it. Likewise if you sequence your sample to very high depth then you will end up with everything appearing duplicated to a similar level, but this could all be biological and not technical. The extreme example of this below is the duplication plot from running a whole lane of sequencing on the small bacteriophage PhiX. Every possible position will be observed thousands of times, but this is not necessarily an indication of technical duplication.
The observation of duplication is further complicated in library types where you do not expect that all regions being measured should be present at an equal amount in the sample. Any sample containing enrichment will have a different expectation of biological duplication depending on the region a sequence comes from. In an RNA-Seq sample for example the expected duplication level will change depending on whether a read comes from an exon, intron or intergenic region, and based on the expression level of the gene it is in. Some regions will be enormously dense with reads, whilst others will be almost empty. This means that at a sequence level the interpretation of duplication plots is very difficult, and a proper diagnosis of duplication will need a more nuanced approach.
The key to evaluating technical duplication in samples which might be biologically saturated is to look at the relationship between duplication and read density. Biological duplication should be a function of the overall density of reads in a region – as the density increases so does the duplication level as random clashes become more frequent. Technical duplication on the other hand will be present at a similar level regardless of read density since it happens independently to each read. If we therefore plot duplication against read density, even in samples with wildly variable densities, we should be able to diagnose technical duplication.
In a sample with variable density, and no technical duplication you might see a plot like this:
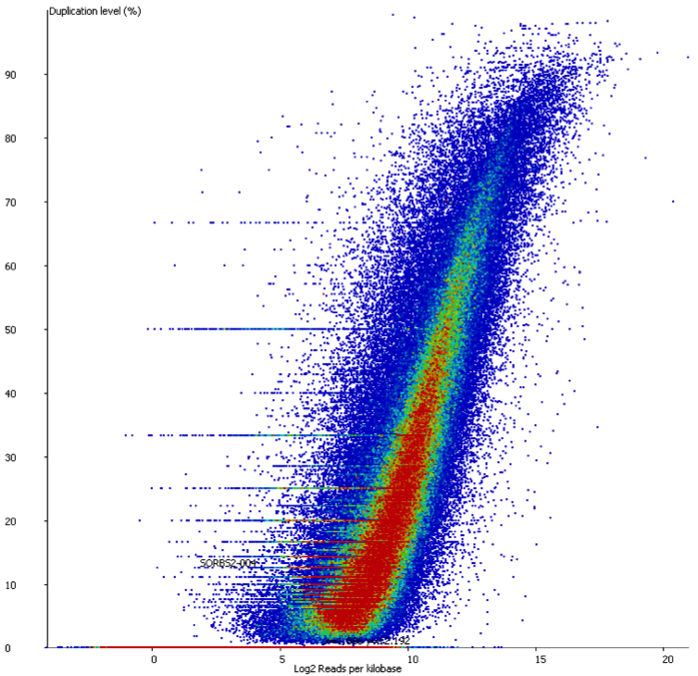
Here you can see that there is duplication present – there are regions with >80% duplication, but you can also see that there are regions with low duplication, and that there is a direct relationship between the overall read density and the amount of duplication seen.
In contrast if you look at a similar sample which has suffered from technical duplication the plot looks very different:
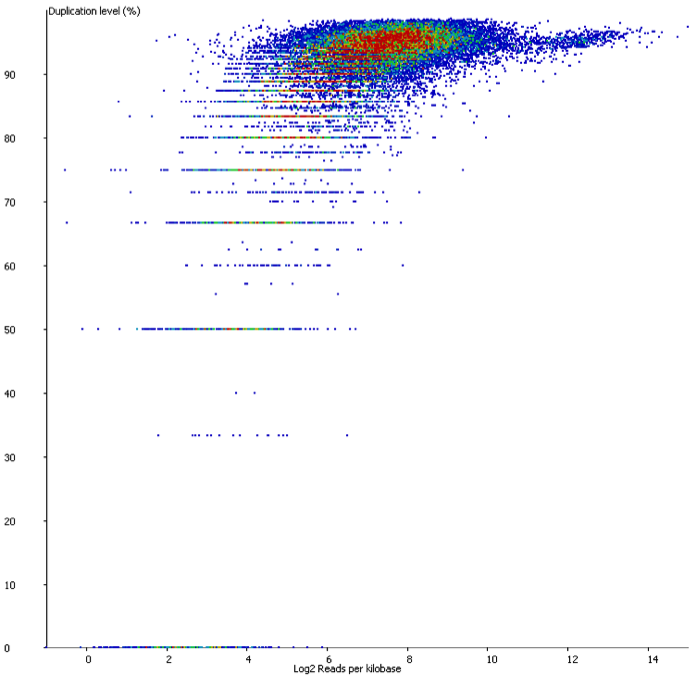
In this case the relationship between duplication and read density has disappeared. Even relatively low density reads have duplication levels of 50% or more and this should be a warning that technical duplication is present.
Mitigation
When thinking about the mitigation for duplication it’s worth thinking about why duplication is a problem. There are two main concerns with technical duplication:
- Technical duplication will artificially inflate the number of observations you appear to have. Any statistical analysis based on counts will have unwarranted amounts of confidence in measures coming from duplicated data due to the repeated observation of the same fragments. This will result in artificially low p-values and over-prediction of hits which are then likely to contain an inflated number of false positives.
- If the duplication you get does not apply equally to each fragment, but prefers some over others, then you might introduce a systematic bias into the data.
The mostly commonly used mitigation for duplication is de-duplication. In this process any place where multiple reads map to the same position in the reference genome will have all but one of these reads removed to completely remove the duplication. The problem with this approach is that it isn’t able to distinguish biological from technical duplication and both are removed. In samples where an even read coverage is expected and the depth of sequencing hasn’t come close to saturating this then this is a reasonable approach, but in samples with variable read densities this will have the effect of capping the maximum read density able to be obtained, and limiting the dynamic range able to be obtained. If multiple samples with different amounts of technical duplication are deduplicated in this way then you will actually introduce differences where the don’t exist.
The plot below shows the effect on quantitation of deduplicating a sample which had no technical duplication. You can see that the loss of value in the quantitation is not even, but is proportional to the read density.
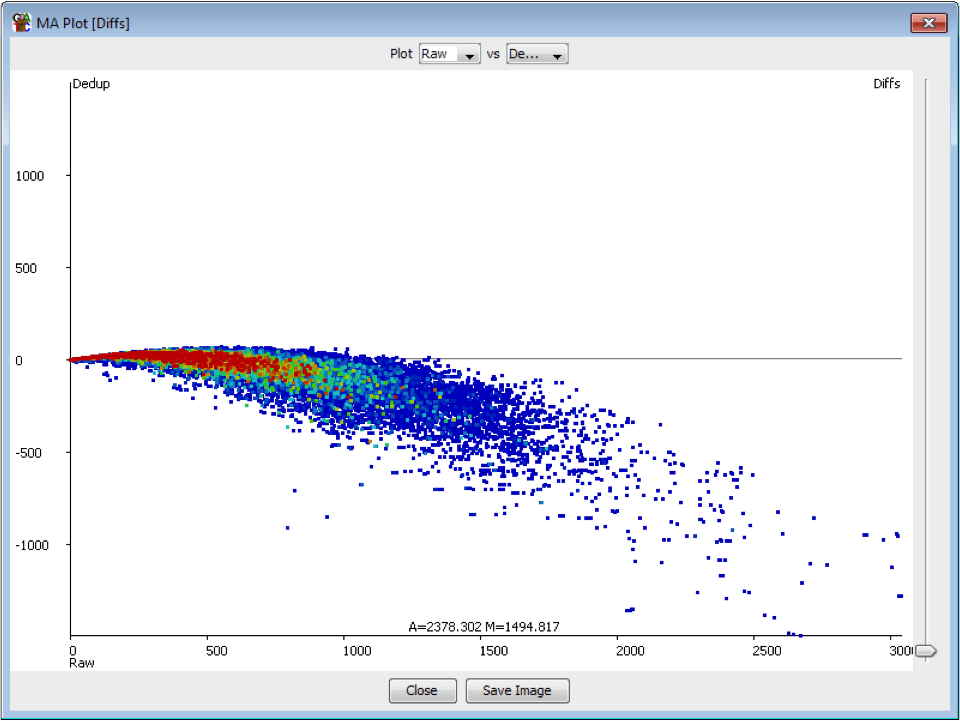
In general therefore deduplication is not appropriate if you have samples with variable coverage where you want to keep a fair quantitation between high and low density regions.
If your concern is with the inflated increase in power from duplication then a better solution might well be to quantitate the read counts as normal, but then try to estimate the overall level of duplication and divide all counts by this amount before moving on to doing statistical analyses. This won’t change the magnitude of the changes seen, but will reduce the overall number of observations.
Prevention
Prevention of duplication can only happen at the library preparation level. The most common reason for observed duplication is a loss of diversity in the library resulting from a loss of material at some point during the library preparation, resulting in the need for more PCR amplification to retain sufficient material to make the final sequencing library. Reduced duplication can usually be achieved by working out how to carry more material through the library production process and therefore being able to reduce the number of required PCR cycles.
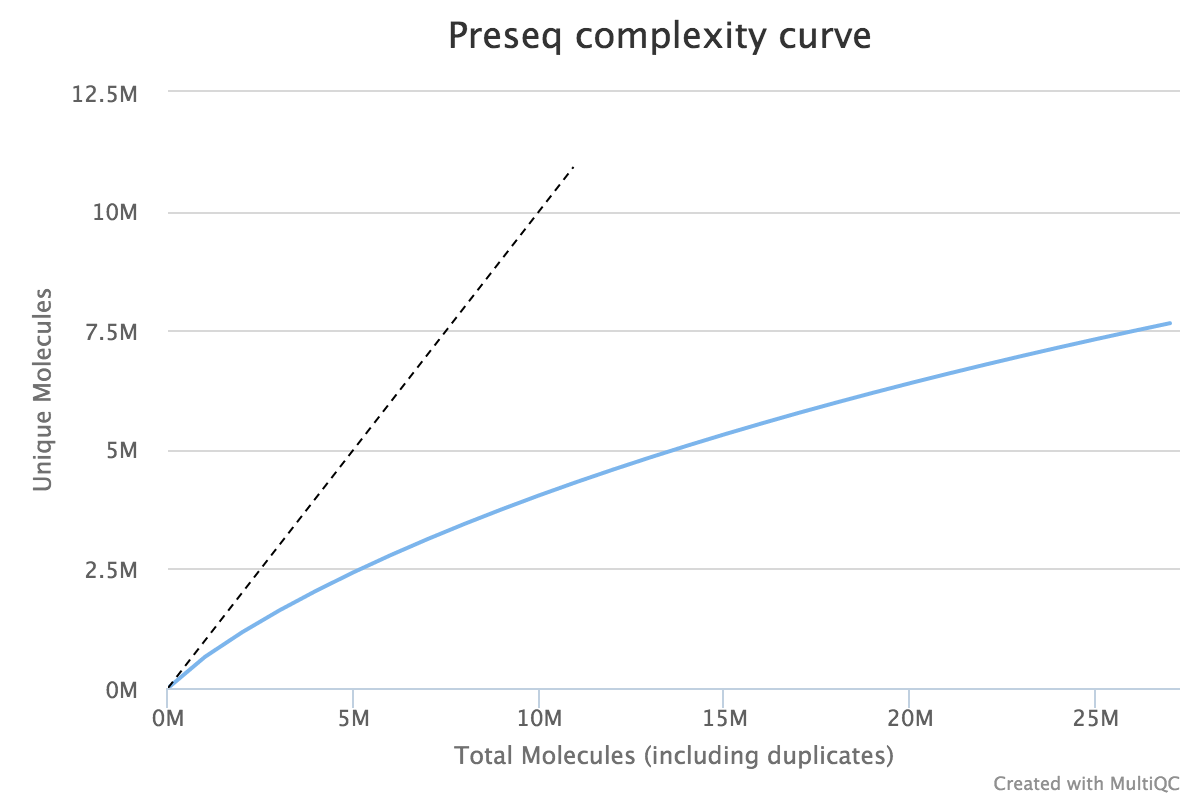
When very large sequencing depths are to be performed from a library it can be useful to do part of the sequencing and then identify when the diversity in the library will be exhausted. The Preseq package can estimate this to produce plots which plot the amount of raw data generated against the amount of usable data after deduplication (plot drawn using MultiQC).
Lessons Learnt
Technical duplication is not always a simple thing to evaluate. It is not a good idea to blindly deduplicate samples since this can cause biases in itself, and a true estimation of technical duplication requires taking the local read density into account.
Software
The sequence level plots shown here were generated in FastQC and the plots of density vs duplication were done in SeqMonk. The density vs duplication plots can also be generated on the command line in DupRadar. The extrapolation of productive sequencing content can be done in Preseq with visualisation using MultiQC.
3 thoughts on "Libraries can contain technical duplication"
Miko
Great website! Very nice post! What about comparing RNA-seq RPKM values generated by including and excluding duplicates? Assuming there is 10% duplication overall, would you expect to see each gene to be 10% lower in the deduplicated RPKMs or would technical duplication only affect a small number of genes (to a higher level than 10%)?
Simon Andrews
The relationship shown in the duplication plot above is basically RPKM (well log RPKM) vs duplication level, so there should be a relationship, but it’s non-linear as the amount of biological duplication increases with RPKM value. It’s also a bounded curve so once you reach saturation of starting points then it’s impossible to tell biological from technical duplication on this basis. The curve will also look different for different samples which have differning amounts of data, even if the duplication level is the same.
In principle you could do some kind of curve fitting to estimate the overall duplication level, but this boils down to the point made in the article about making an overall estimation and dividing each count by that amount. It’s a more crude tool than something which accounts for variability in individual genes, but at least it shouldn’t bias the overall counts.
Phil Ewels
It may be worth mentioning that DupRadar has functionality to fit a curve to the % duplicates vs RPKM plot. This generates two values: “duplication rate at low read counts” and “progression of the duplication rate”. These are probably a more useful metric than the raw % duplicates for the entire dataset.
Comments are closed