Introduction
In many ways mapping of sequence reads to a reference genome is a solved problem. If we know the sequence of the underlying genome and have a good error model for the data generated by the sequencing platform then we can show that it’s possible to assign the most likely mapping position for a read, and to associate this with a meaningful p-value for the likelihood that the reported position is, in fact, correct.
This rosy picture can become muddied somewhat though. A simplistic mathematical view of mapping starts from the assumption that we have perfect knowledge of the reference genome, and in practice that’s not true. Even where we have very mature genome assemblies for human / mouse etc there are still relatively large regions of the genome where the exact sequence is not known. Mainly these regions consist of long stretches of highly repetitive sequence which is almost impossible to position accurately with current sequencing technologies. In some cases these regions may even be variable between different individuals or cells so there is no true reference. Examples of these types of regions would be telomeres, centromeres and satellite sequences, but other smaller repetitive regions will also suffer the same problem.
These problematic repetitive regions will still generate reads in an experiment and these cause trouble for the read mappers. Because the true mapped position for these reads isn’t shown in the assembly the read mappers can end up mis-judging the likelihood of the next best position they find as being correct, leading to these reads being incorporated into the data used for downstream analyses.
The figure below shows a simplified view of the problem.
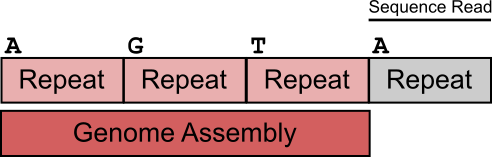
In this example we have a stretch of repeats with a minor variation in their first base. 3 of the repeats are within the genome assembly, but the last one was not assembled and doesn’t appear in the reference. If a read comes from this last repeat the correct mapping answer would be to map it to either the first or last copies of the repeat (which contain an A), but to flag it as a non-unique alignment. Since the read mapper can’t see the last repeat in the reference though the read will incorrectly be mapped to the first repeat, and will be listed as a unique alignment, since this is how it appears.
The Symptoms
These types of mis-mapping occur in all library types, but are very easy to spot when you have a library which should produce even coverage over the whole genome. The example below is a genomic library which is showing only reads reported to be a unique best alignment against the genome and you can clearly see a number of very high coverage peaks where mismapped reads have accumulated.
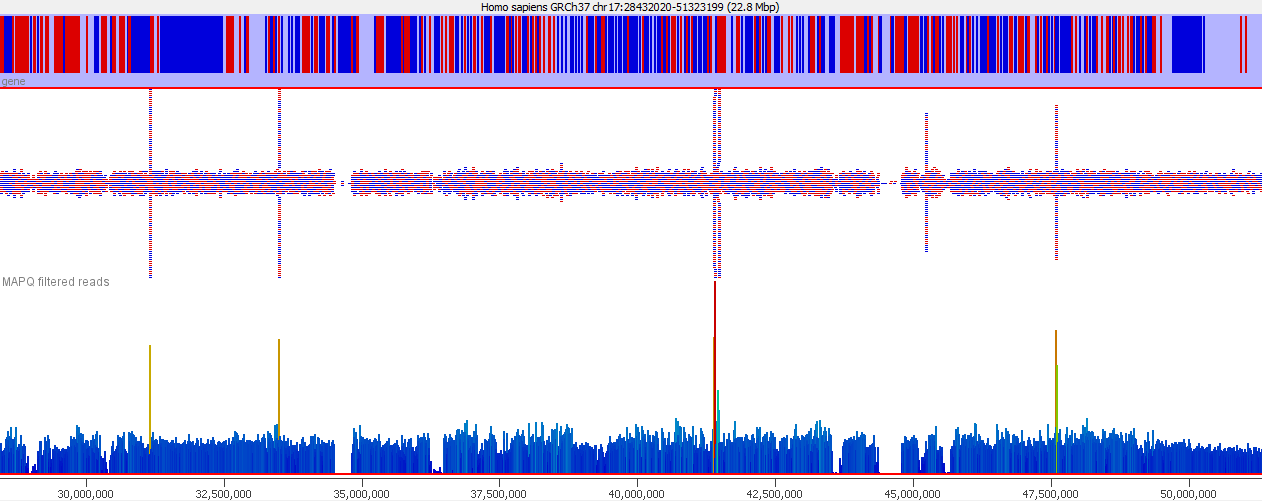
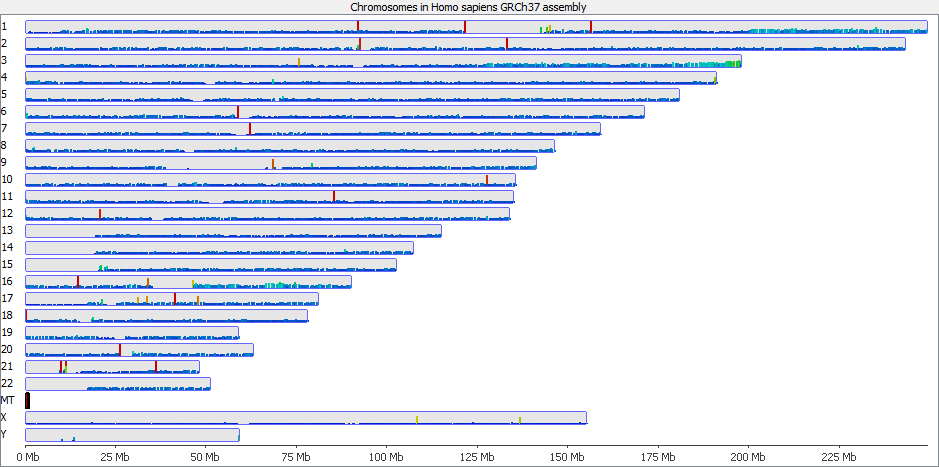
Looking on a wider scale you can see that these peaks often occur at the edges of holes in the genome. This is because these regions tend to be enriched for the class of repeats which fill the hole in the genome, so mis-mappings tend to accumulate there.
It’s probably also worth pointing out that although this issue is most obvious in the largest classes of repeats, it will also affect the majority of repeat classes to a lesser degree, and could even affect repetitive gene families.
Mitigation and Prevention
There are two approaches to dealing with these types of reads.
- You can try to identify the places in the genome where the mis-mapped reads accumulate and mask these from any analysis you’re doing as being unreliable.
- You can try to adjust the way you do your mapping to prevent the erroneous mapping in the first place.
Filtering coverage outliers
Identifying regions which accumulate mis-mapped regions is relatively simple in library types where even genomic coverage is expected. You can use standard methods for outlier detection to find places in the genome which have a statistically unlikely density of reads. Most of these regions have coverage levels several orders of magnitude above the background so fairly stringent cutoffs can be used to avoid losing other regions with more marginal enrichment for other reasons.
If however you are working within a library type where enrichment is expected (ChIP-Seq for example) then this type of approach may not be practical. Because the mis-mappings are characterised by the genome assembly and mapper used though, you can transfer the set of positions you have learned on another dataset (or on the input for the ChIP) and use these to mask the enriched data.
For some genomes there are published lists of blacklisted regions assembled from large genome sequencing projects which can be used as annotation tracks to filter your data or results and to save you from having to define problematic regions in your own data. These predictions can be an easy shortcut to use if you work in one of the genome assemblies they support.
Improving read mapping
The other approach to take to fixing this problem (which can be used in concert with the above filtering), is to try to get more accurate mapping in the first place. The root of this problem is that some regions which are in the genome are excluded from the assembly and are therefore invisible to the mapping programs.
In some cases the missing regions are present in shorter assembly contigs which are part of the original draft assembly but are not able to be placed into the scaffolded chromosomes. These additional contigs are sometimes distributed with the genome sequences, but excluded from analysis. Leaving such short contigs in place during mapping will improve the mapping statistics, even if those contigs aren’t actually analysed in the downstream pipeline.
Another approach is to try to construct artificial sequences containing the missing sequences in an unstructured format. These ‘read sinks’ or ‘sponge databases’ aren’t intended to generate data to analyse directly but provide enough context sequence for the read mappers to correctly interpret the correctness of mapping for repetitive reads.
References