Introduction
Repetitive regions are one of the most tricky areas of the genome to work with and yet are also potentially very biologically interesting. When analysing any type of enrichment experiment people are often interested to look at the repeat sequences to see if anything interesting comes up. Unfortunately these regions are prone to producing technical artefacts, and in some cases these can be very convincing.
The effect described here occurs in any library where there is some degree of technical duplication. Additionally the reads must not have been filtered to retain only uniquely mapped reads (ie keeping one randomly selected position from the set of possible mapped positions), and the data must have been deduplicated.
Under these circumstances repetitive elements in the genome will appear to be enriched. The amount of enrichment can be quite high (it’s proportional to the amount of technical duplication, so bad libraries appear more enriched), and the effect is very well localised to the repeat elements. It is very easy to become convinced that you’re seeing a true biological enrichment.
The image below shows a SeqMonk aligned probes plot for the full length instances of LINE1 repeats. Each line is one repeat instance, and the depth of colour represents the number of reads mapping to that part of the sequence. You can see that in the green ChIP plot there is a strong enrichment over the repeat which starts abruptly at the start of the repeat. In the corresponding input sample on the right there is a slight enrichment, but nowhere near the amount seen in the ChIP.
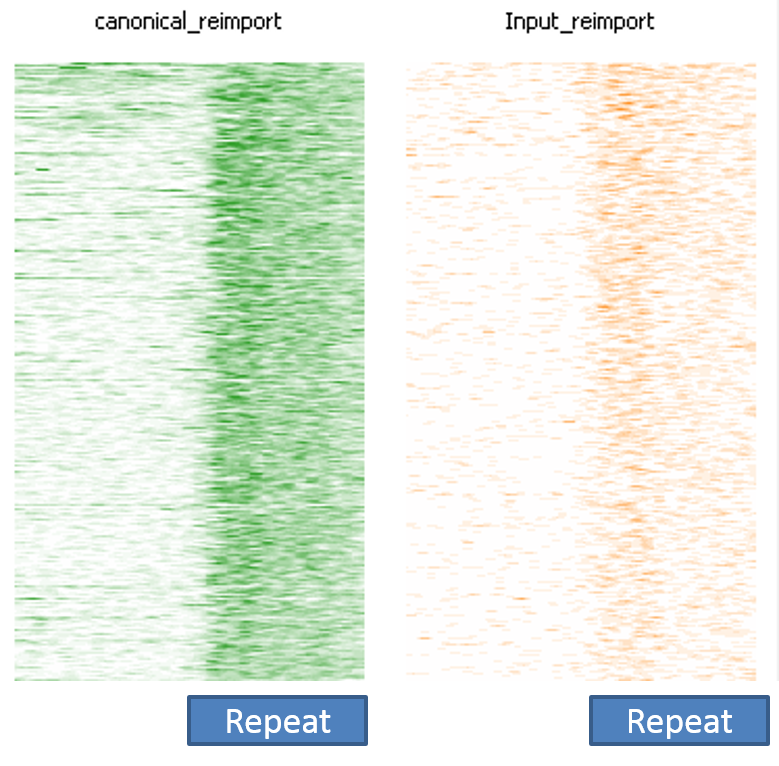
This impression of biological validity is further enhanced by the fact that the enrichment only really happens over full-length LINE1 instances. Partial copies do not show anywhere near as much enrichment.
Unfortunately this effect is completely technical and there is no true enrichment. The underlying cause is how ambiguously mapped reads are handled.
If we consider a simple case such as the one below where we have one non-redundant region (in green) and two copies of a repeat (in blue), and in each of them we have a single region sequenced, but this has been PCR duplicated so we get two reads over each position.

The problem is that our read mapper can’t tell the difference between repeat 1 and repeat 2 since they’re the same sequence. When presented with multiple options for where to position reads the default action for most read mappers is that they randomly select one of the valid positions and report that (whilst lowering the mapping quality value reported). This means that the mapping we actually get might well look like this:

The non-redundant reads will both have been positioned correctly, but the repetitive reads will have been split between the two repeat instances.
If we now deduplicate the data then we get this:

Because the non-redundant reads were positioned correctly they were also correctly deduplicated to leave only a single read, but because the repetitive reads were spread over the different repeat instances the PCR duplicates didn’t end up at the same genomic position, and both copies survived deduplication. Overall then we should have had one read in the NR region and two in the repeat regions, but we had 4 in the repeats instead, leading to the impression that the repeats are enriched for reads.
In real data you will also see that complete copies of larger repeats will exacerbate this effect, with partial repeats appearing less enriched. This has nothing to do with the biology of the repeats and simply reflects the fact that complete, active repeat copies tend to be more similar to each other than partial copies which can degrade, and therefore become more distinct from each other and more likely to be uniquely mappable.
Mitigation
In these cases the effect would not be present if the data had not been deduplicated, or if the reads had been pre-filtered for unique mapping. Filtering for uniquely mapped reads will actually deplete the repeat regions of reads, but in a way which should be the same for different samples regardless of their technical duplication level.
Prevention
This effect can be prevented fairly easily once you know that the effect exists. One of the problems we’ve seen is that people who were aware of the effect could still suffer from it if they were unwittingly performing a deduplication. For example, many peak callers (for example MACS) include a deduplication step in their internal analysis pipeline, so even if you don’t explicitly deduplicate your data, you can still end up with biased sets of peaks.
Lessons Learnt
Repeats are icky. Always be super-cautious when making conclusions about their behaviour.
Software
The data plot shown in this article was created with SeqMonk.