Introduction
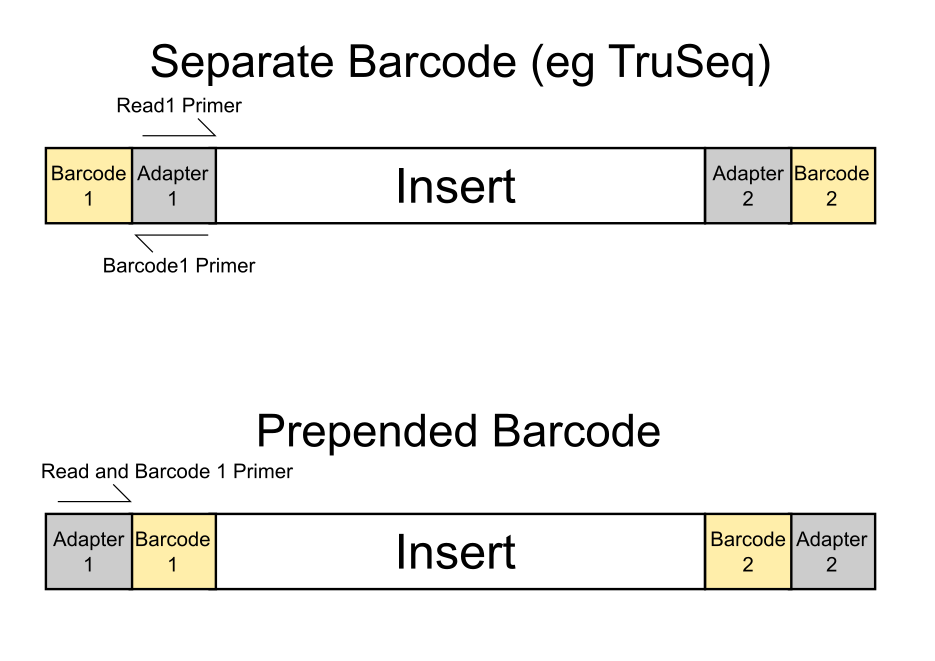
Most sequencing platforms have the ability to generate way more data from a single sample than would be required for many types of experiment. Rather than waste the extra sequencing capacity it is very common to mix samples together so that multiple samples can be run in a single sequencing lane. In order to be able to separate the data coming from the lane modified adapters are used which contain a sample specific DNA tag called a barcode. Depending on the platform these barcodes might appear at the start of the normal sequence read, or they might be separately sequenced in a separate sequencing read. In any case the idea is that by reading the barcode sequence from an individual read and matching it to the set of barcodes used in the lane you can split the data back into the individual libraries which were mixed together.
This early stage of processing is one of the most common places to have problems with data processing and there are some very common modes of failure which can potentially lose large amounts of valid information from a run.
The Symptoms
The most common and obvious symptom that there was a problem with barcoding is that one or more samples end up with very little data in them. In these cases unless you have an easy way to investigate the details of the barcode splitting it can be difficult to ascertain whether the failure is a real problem with the sample, or simple a processing error with the barcode splitting.
On some sequencing platforms the barcode splitting is done as part of the early stage data processing, so end users may not be able to see the details of what happened, but finding a way to get to the composition of the barcode reads and looking how these relate to the expected samples can be invaluable in determining what has gone wrong.
Diagnosis
The plot below shows the sort of information you need to be able to evaluate how well a barcode split has gone. This particular plot is generated by the Babraham Institute’s sequencing pipeline, but similar plots could be constructed from the raw barcode splitting metrics which should be available on most sequencing platforms.
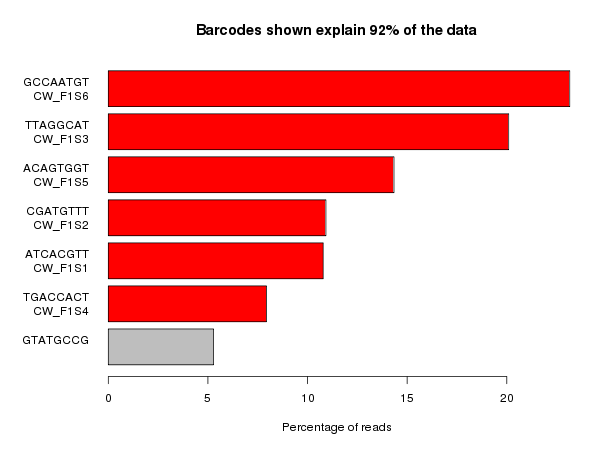
This plot shows the set of barcode sequences which were most frequently observed in the dataset (anything over 1% of the data). The barcodes which were listed as being present in the sample are highlighted in red and anything in grey is unexpected. At the top of the plot you can see the proportion of the whole dataset which is shown in the plot – this can be useful for determining if there is a large amount of reads with very variable sequences.
Ideally what you’d like to see in these plots is only the expected barcodes, and all of them with the same frequency. In practice balancing samples in a lane is not an exact science so some variability between barcodes is to be expected.
In the plot above the unexpected barcode comes from a PhiX spike in control added to the lane, so this is fine and means that the sample should be OK to process. In many cases though the splitting does not work smoothly.
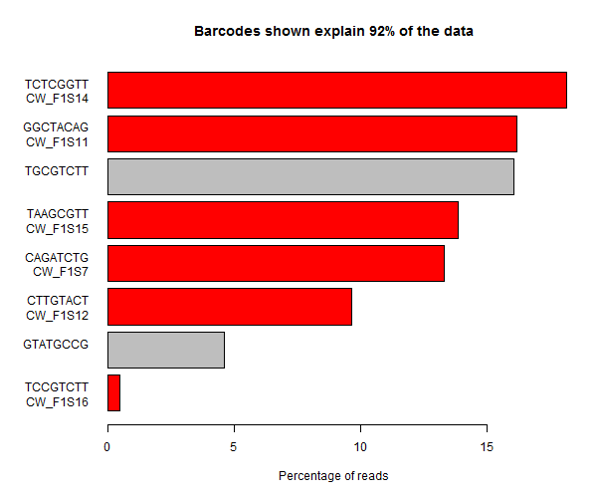
In this sample you can see that one of the expected barcodes is present at a very low level (not zero though), and there is an unexpected barcode taking up a large proportion of the lane. If you are not able to see the barcode splitting stats for this data then you might assume that one of the samples had failed, or that the sample mixing had been poorly calculated. It’s only by looking at the whole picture that you can see that in this case it’s more likely that the barcode has simply been mis-typed when creating the sample sheet and that the data was present in the lane, but has been incorrectly discarded.
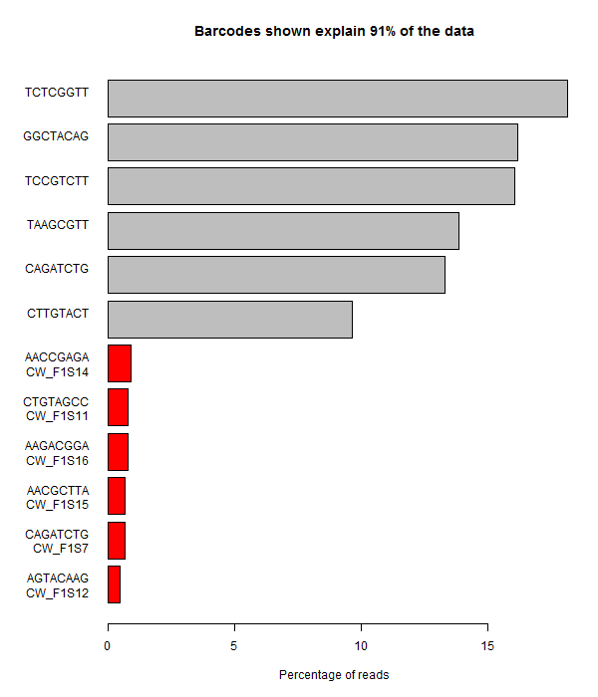
A more extreme version of this problem is shown here. In this case all of the expected barcodes are very low, and there are a set of unexpected sequences observed. The problem here was that although the user added the correct sequences, they got them in the wrong orientation, so that the actual sequences produced were the reverse-complement of what they expected. This type of error is very easy to make if users have to actually enter the sequences of barcodes, rather than entering something more abstract such as a tag number.
In addition to these relatively simple cases there are more subtle things which can go wrong in barcode splitting which can be very difficult to track down. The image below shows the barcode splitting summaries from a number of datasets from the same group run over a number of months. Have a look at the results and see if you can spot a problem, and identify which sample or samples are affected.
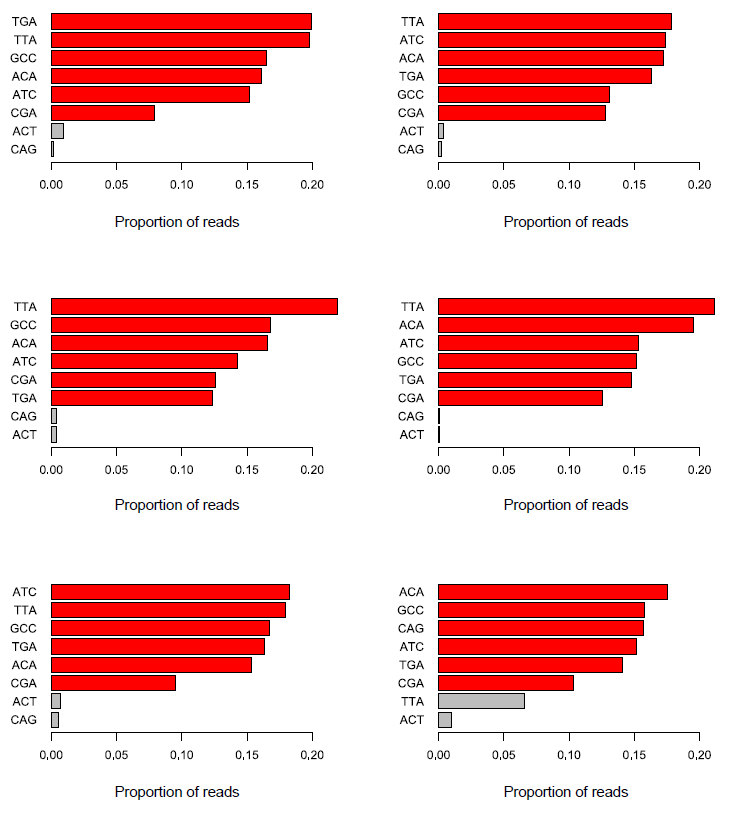
The answer here is that all of the datasets have a problem, but because of the way the barcodes were used it only becomes apparent in the final dataset. What we see in the last dataset is the presence of an unexpected barcode (TTA). In this case this wasn’t a known spike-in, so there was no obvious explanation for where it had come from. It’s temping to ignore these types of minor contaminant and continue to work with the rest of the data, but it is worth tracking down these sources of contamination.
In this case the reason for this extra sequence is that the barcode stock for the CGA barcode had become contaminated with TTA, so whenever a CGA tagged sample was put into a run, around a third of the reads from that sample would actually have a TTA barcode. The reason this hadn’t shown up before was that all of the previous runs had used both TTA and CGA in the expected barcodes. Knowing about this contamination we can see that there is a general bias for TTA tagged samples to have more reads than average, and CGA to have fewer reads than average, but never enough of a discrepancy in an individual experiment to cause concern.
The effect of this type of problem is really quite bad though. It means that the data from all TTA tagged samples is mixed with whatever was tagged with CGA, and there is no way to separate them. In the actual case from which this example is drawn this meant either re-analysing data excluding the contaminated samples, or rerunning them with a barcode combination which would allow them to be correctly split. Needless to say, even though this type of confusion is potentially very serious, it is also very easy to miss.
Prevention
Ultimately barcode splitting problems are going to happen and there’s little you can do to completely prevent mistakes from happening. There are a number of steps which will help though.
- Ensure that you correctly monitor and report on your barcode splitting. This means that the data you extract from a lane must be put in the context of everything which was observed in that lane. In particular don’t ignore the reads which went into the discard pile – these normally contain the critical information you need to quickly diagnose problems with the splitting.
- When creating systems to handle samples and barcodes try to make correct entry of codes as simple as possible. Ideally give people a way to enter tag names / numbers rather than entering sequence. If they do have to enter barcode sequences then do sanity checks on the sequences entered: Are the sequence all the same length, are there any duplicates, are there any non-GATC characters etc.
- Whilst there are definitely good practices about which combinations of barcodes to use, try not to always stick to the same subset of barcodes, mix around the combination of codes used where possible, and be suspicious if certain codes produce consistent contaminants, or are consistently over-represented in the data.
Lessons Learnt
Barcode splitting seems like a trivial part of the data analysis pipeline, but it’s one of the most frequent causes of error. Adding QC and sanity checks to this step can normally identify problems very quickly and save a lot of wasted effort downstream.
3 thoughts on "Barcode splitting doesn’t work as expected"
Joe Foley
There’s a nice program called deML that does barcode splitting more intelligently than Illumina’s simple-minded heuristic, though it’s not maintained and needs some help to work on modern FASTQ data.
Using it I’ve found that Illumina’s TruSeq index 23 fails on the NextSeq, which is unsurprising since that index is G-rich and G appears as no signal in the two-dye chemistry, so that index starts to look like PhiX, which has no barcode (!). Incidentally, to diagnose or tweak the barcode splitting you need to disable the automatic removal of PhiX reads in Illumina’s pipeline.
Simon Andrews
Although PhiX doesn’t have a barcode in the strictest sense, you do get sequence from a PhiX lane when you prime with the barcode adapter – it’s just the upstream sequence in the adapter. I’d be very disappointed if it matched any of the standard illumina barcode sequences since that would mess up any mix of barcoded and non-barcoded samples.
For our sequencing pipeline we actually don’t use the illumina barcode splitter at all. Instead when we run bcl2fastq we tell it to generate fastq files for the barcode reads and then we use our own in-house code to do the splitting and generate the sorts of graphs we showed in the article.
Patrick Reilly
Glad to see someone else is sorting these issues out too! We’ve been seeing some interesting results from parsing Illumina data from different facilities. We too get the data split into sequence read and index read files (e.g. for single-indexed SE: R1 and I1 FASTQ files, for dual-indexed PE: R1, R2, I1, and I2 FASTQ files) and split using in-house scripts, but the parsing process takes a very long time. One time-saving pre-QC step we’ve found is doing a simple one-liner histogramming of index reads:
Just having a quick look through the TSV gives you roughly the same information as the plots you showed prior to any parsing. All of our runs show >=1% of the lane comprised of 1-mismatch index reads, which are easily (and unambiguously) recoverable, and you can tell this by visual inspection of the file.
Comments are closed