The RNA-Seq QC Plot
The RNA-Seq QC plot is intended to be an initial step in the analysis of RNA-Seq data.
It does some simple checks on your data to determine if there are any obvious biases
in the data, and whether any biases are consistent between your different replicates

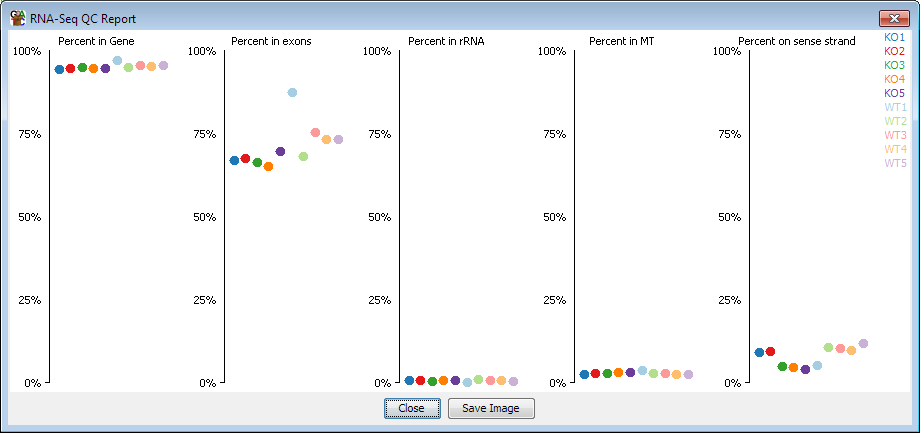
The metrics which the plot calculates are:
- What percentage of your reads fall into genes. A low value here would indicate
potential DNA contamination
- What percentage of reads in genes fall into exons. A low value here would indicate
either DNA contamination, or possibly just a high proportion of unprocessed transcripts
- What percentage of reads fall into rRNA. This will only account for mapped reads falling
into annotated rRNA features, so will normally be much less than the actual amount of rRNA in
the starting library
- What percentage of reads fall into the Mitochondrion
- If present - what percentage of reads fall into the ERCC control sequences
- What percentage of genes have any signal in them at all. This would be defined as having
at least one read in an exon of that gene
- What the relative amount of data for the different stores is. The number of reads in the
largest data store is defined to be 100% and the amount of data in all other stores is reported
relative to this. Some variability in this value is expected, but huge discrepancies might indicate
a problem.
- What percentage of reads fall onto the sense strand - depending on the type of library
you've made this value could be expected to be near 0%, 100% or 50%
Although there is information to be gained directly from each of these measures, often the
most important thing to check is that they are similar for all of your replicates, since a
difference would indicate some kind of systematic bias.
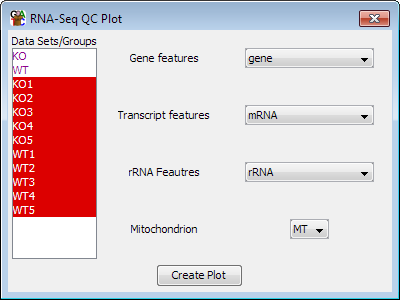
Options

The options are simply a way to select which feature track represents the different types
of feature used by the plot. The program will try to determine these automatically, but you
can change them manually if needed


